新加坡股市微观
明年今日 • • 51550 次浏览股票牛熊一般有两个简单定义:
1. 从高位跌20%是熊市。
2. 跌穿200日平均线是熊市。
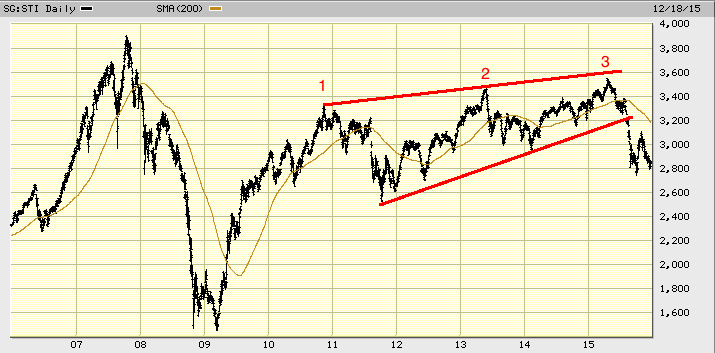
新加坡在2009年开始的牛市中有三个主要顶点:2010年11月9日,2013年5月22日,2015年4月15日。
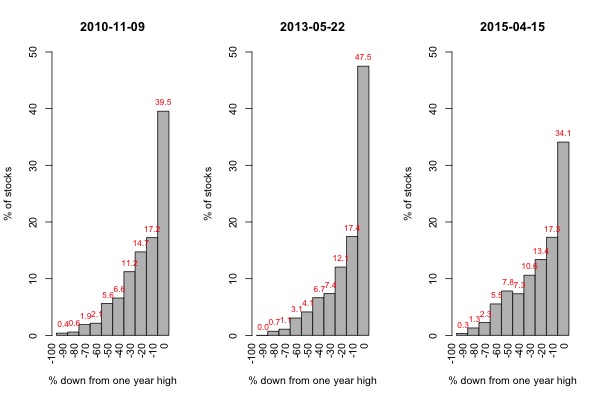
A。从各股票相对于过去一年高位来看(例如,在2010年11月9日,39.5%的股票在过去一年高位的0-10%以内):
2013顶点是市场内部最强的,64.9%的股票在过去一年高位的0-20%以内。而2015年顶点是最弱的,只有51.4%。所谓的越来越少的股票参与牛市。
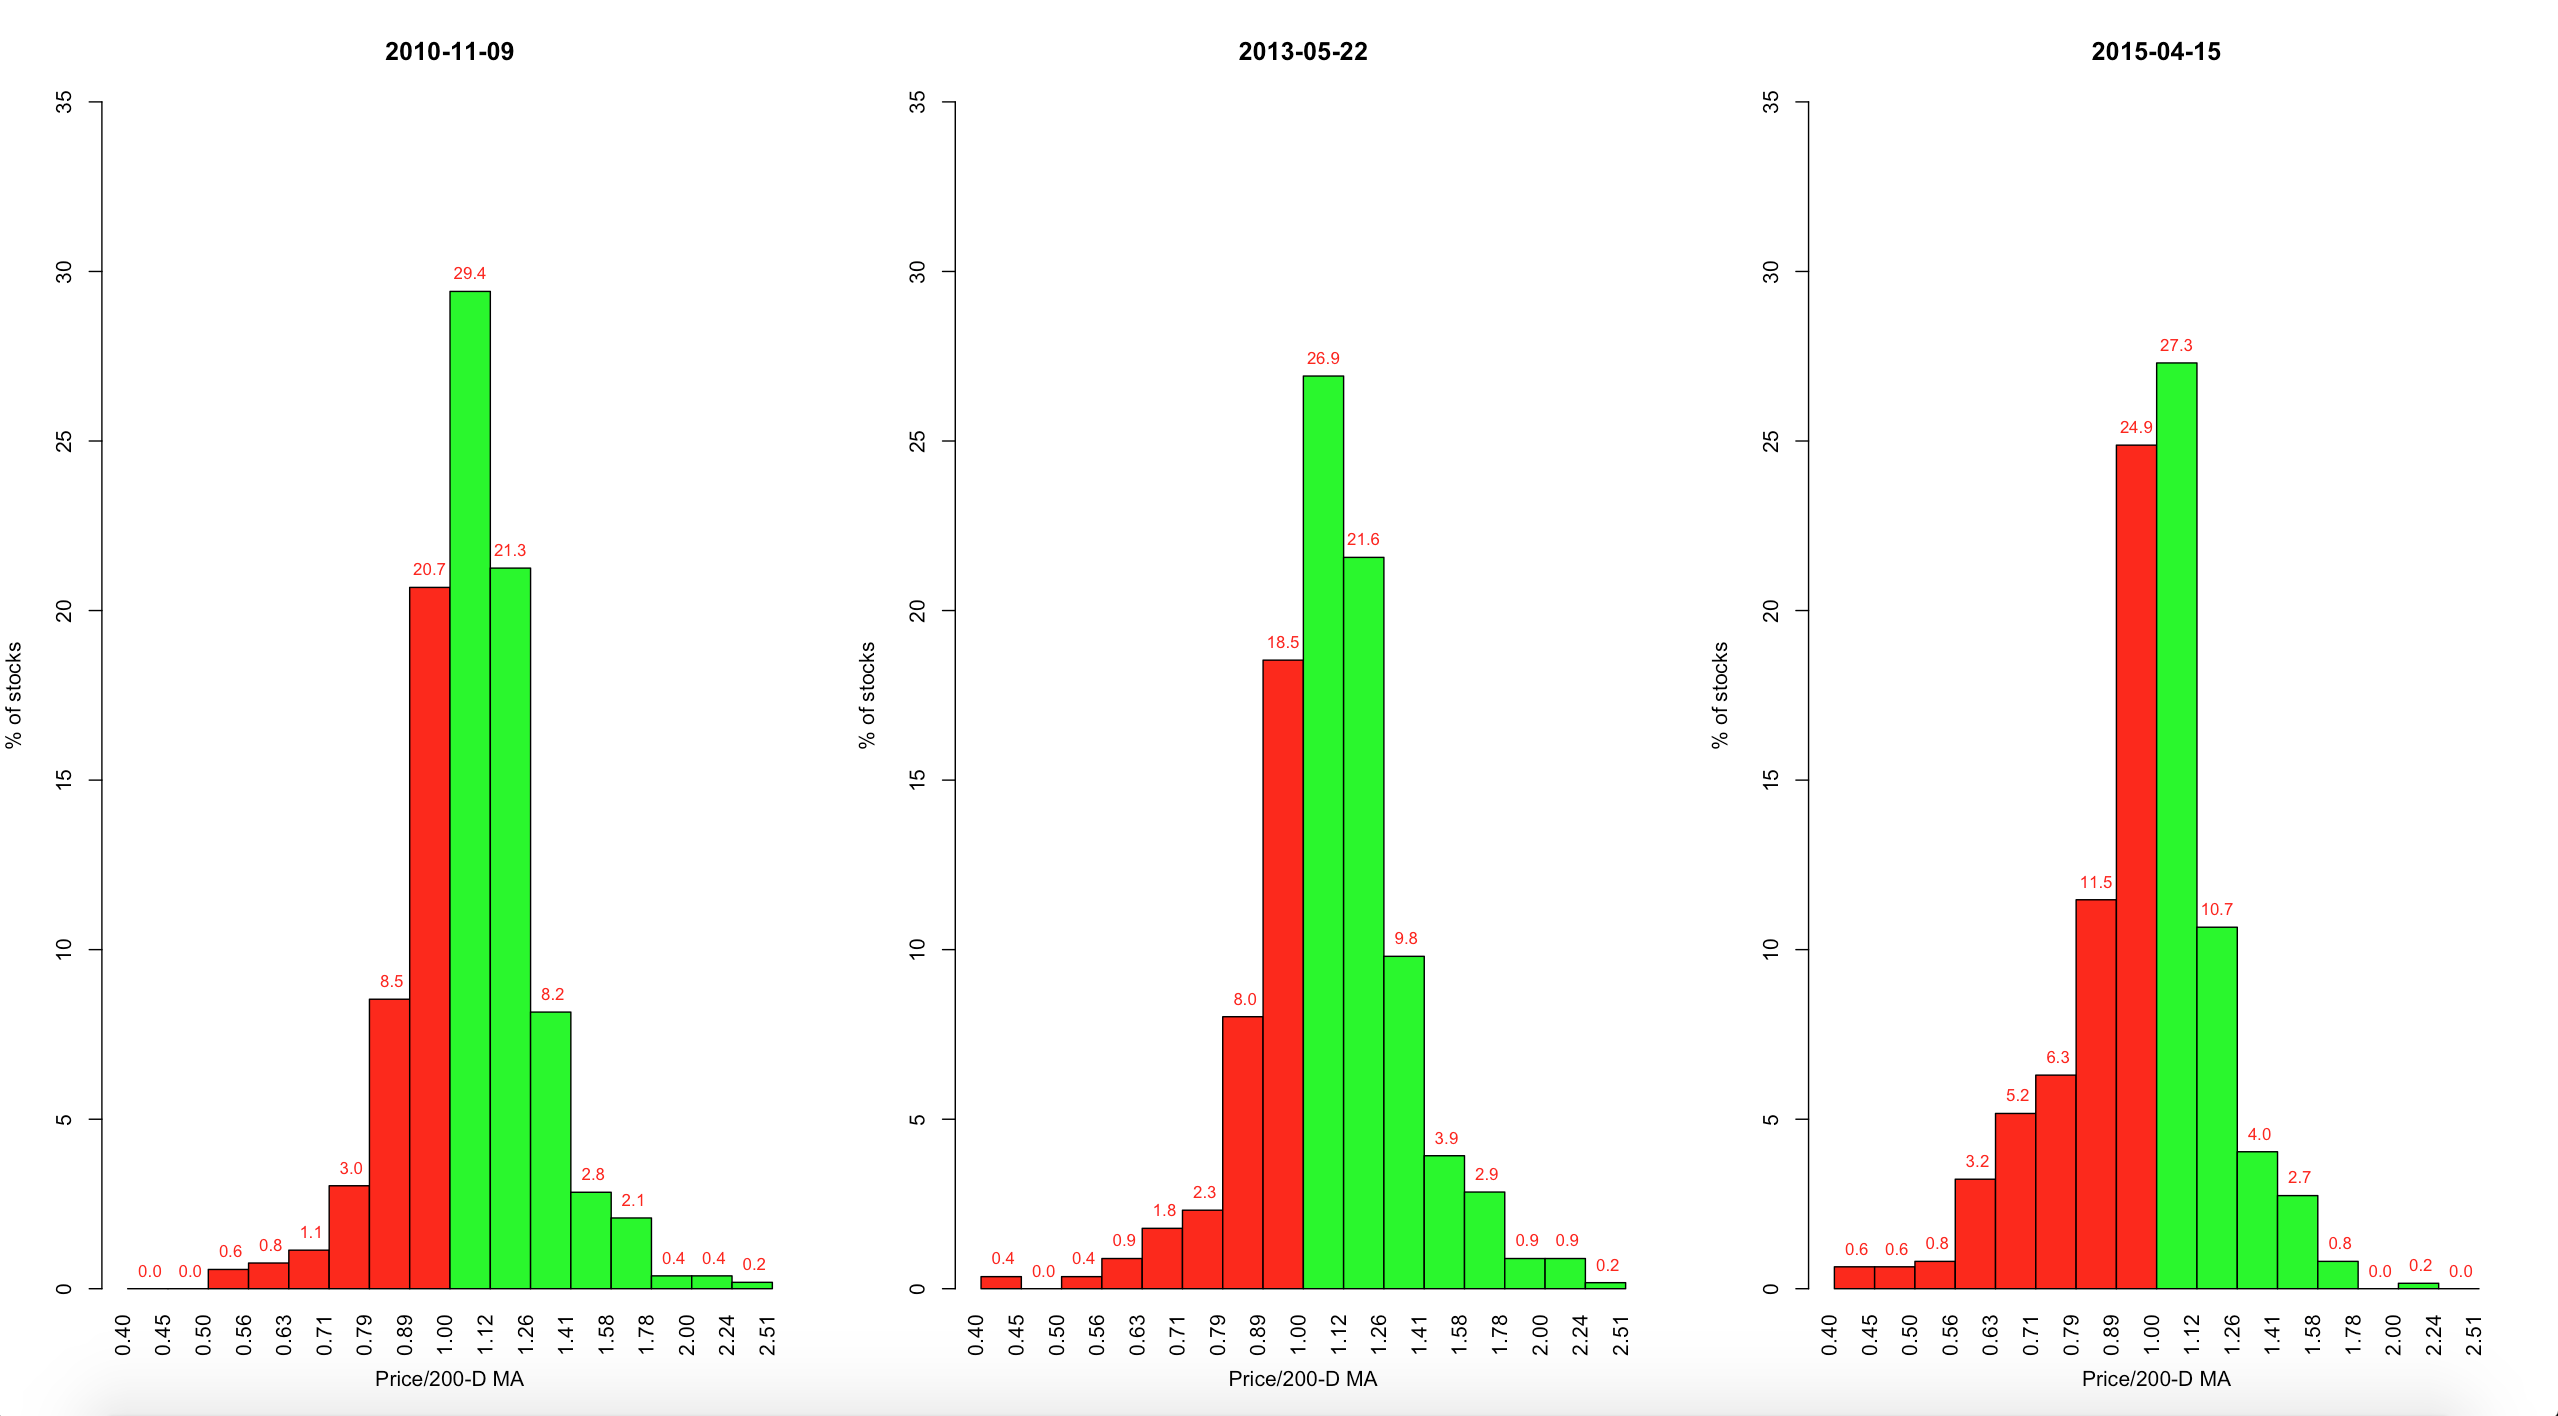
B。从各股票相对于200天平均线比率来看(例如,在2010年11月9日,29.4%的股票在200天平均线1-1.12倍以内):
2013顶点是市场内部最强的,67.4%的股票高于200天平均线。而2015年顶点是最弱的,只有45.9%。也是越来越少的股票参与牛市。
从微观上看,2015的高点是一个secondary top, 2008开始的牛市应该已经结束。
附录:Paul Tudor Jones谈200天平均线
One principle for sure would be: get out of anything that falls below the 200-day moving average.”
I teach an undergrad class at the University of Virginia, and I tell my students, “I’m going to save you from going to business school. Here, you’re getting a $100k class, and I’m going to give it to you in two thoughts, okay? You don’t need to go to business school; you’ve only got to remember two things.
The first is, you always want to be with whatever the predominant trend is. My metric for everything I look at is the 200-day moving average of closing prices. I’ve seen too many things go to zero, stocks and commodities. The whole trick in investing is: “How do I keep from losing everything?” If you use the 200-day moving average rule, then you get out. You play defense, and you get out.
来源:http://tradethetape.com.au/tag/paul-tudor-jones/
-
#1
STI今年走势美图
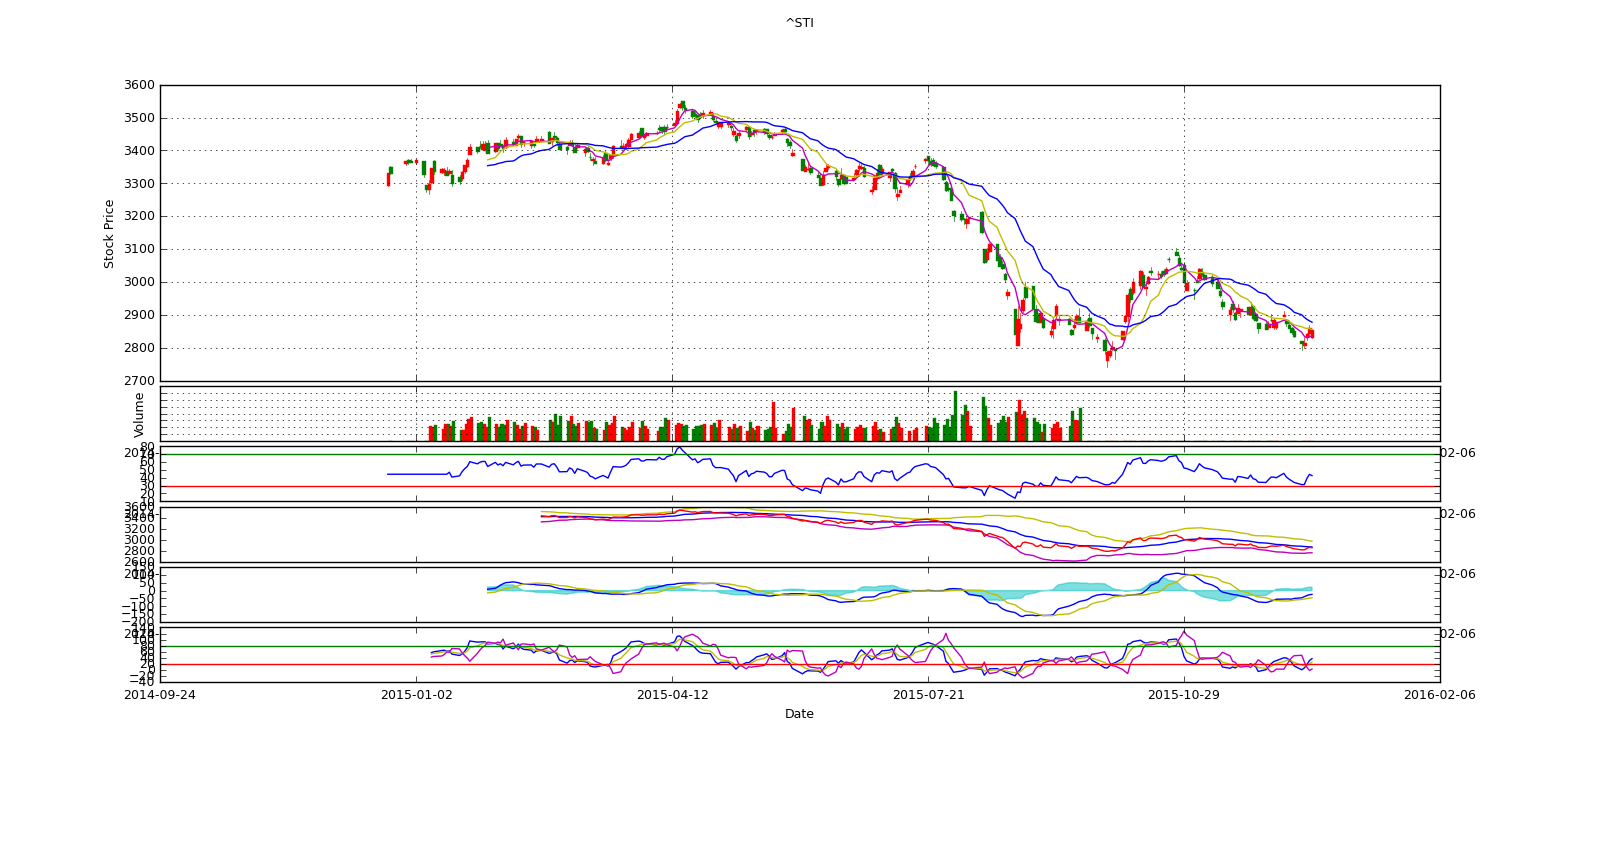
虽然不做SGX 但还是看了下走势 附STI今年走势美图
Yahoo finance的免费数据好不靠谱 居然成交量信息从9月20号就没了。。。
低位几次在2800挣扎
下面的指标里的红线绿线是我设置的相对阈值 仅供参考
虽然不做SGX 但还是看了下走势 附STI今年走势美图
Yahoo finance的免费数据好不靠谱 居然成交量信息从9月20号就没了。。。
低位几次在2800挣扎
下面的指标里的红线绿线是我设置的相对阈值 仅供参考